SINCA
Service and System Based Contract for Carbon Accounting for Vegetation and Land Use in Singapore.
Singapore is a Party to the United Nations Framework Convention on Climate Change (UNFCCC) and reports regularly statistics of its greenhouse gas (GHG) emissions and removals from various sectors in its National Communications and Biennial Update Reports. The National Parks Board (NParks) of Singapore provides statistics of the Land Use, Land-Use Change and Forestry Sector (LULUCF), and has engaged the Austrian Natural Resources Management and International Cooperation Agency (ANRICA) to establish a national GHG Monitoring, Reporting and Verification (MRV) System. The expert institutions involved in the consortium manage all aspects from remote sensing, biomass and soil inventories to modelling and IPCC reporting. JOANNEUM RESEARCH was responsible for the production of large scale activity data on wall to wall basis by means of remote sensing, image analysis and geo-informatics.
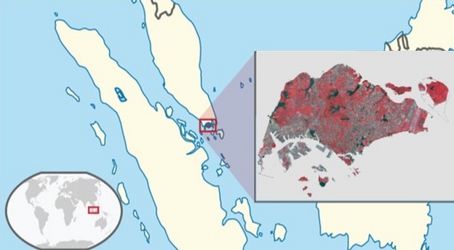
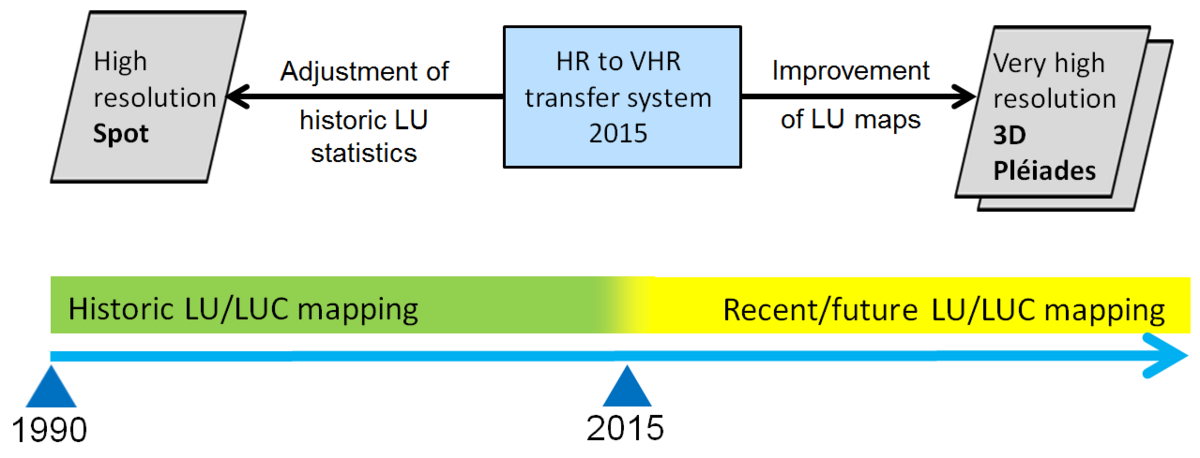
Annual monitoring of land cover, land use (LU) and land-use change (LUC), based on different satellite data sources, serves as input for estimation of carbon stock and emissions. The historic development, which is needed to analyse trends, is based on annual Spot image mosaics for the years 1989 to 2014 with a ground resolution of 5 to 20m. Recent years are mapped based on very high resolution (VHR) Pléiades data which meets the country’s requirement characterized by heterogeneous spatial LU distribution and the high dynamic of LUC.
About a dozen IPCC-compatible land-use categories out of four land-cover classes are distinguished based on rules jointly defined by the consortium. Ground-truthing exercise including fieldwork is supported by means of VHR data interpretation and additional data provided by NParks, resulting in classification of annual LUC-categories. We chose segmentation of radiometrically calibrated image mosaics and subsequent classification of land cover, followed by rule-based assignment of LU and LUC as a well proven and traceable approach.
The LU maps of the years 2015-2017 could be substantially improved by the use of Pléiades data with an enhanced geometric resolution of 0.5m. Whilst the LU category definitions remain consistent over the entire time series, LU area borders are much more accurate for the current and future LUC assessments. Furthermore, as innovative aspect 3D information derived from stereo image pairs allows for significantly improved distinction between high and low vegetation categories.
The challenges of different resolution and accuracy between historic and contemporary data were tackled by inventive techniques supported by redundant mapping of both Spot and Pleiades data within the years 2014 and 2015. The results are a LU map for each year as well as annual LUC statistics being essential components for reporting.
This is possibly one of the few applications where very high resolution images are used on a wall-to-wall format for reporting of carbon emissions/removals at a country level. Other applications comprise the visualization of effects of Singapore‘s “City in a Garden“ initiative, ecological modelling, 3D visualization, and urban tree (height) monitoring.
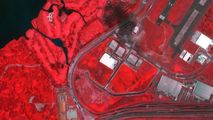
Pléiades image
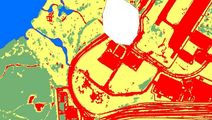
LC from Pléiades
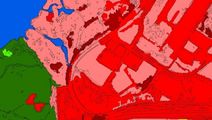
LC from Pléiades (outlines)
and LU Spot (coloured)